Company Analysis - Profit & Loss Analysis through visual representation
Minimalistic approach to analysis of Profit & Loss Statement
Profit and Loss statement forms a key part of financial statements of the company. In this post, I’ll explain how to arrive at a level of margin of safety through visual representation of Profit & Loss Statement. Profit & Loss Statement summarises the transactions like sales, expenses, etc done by the company during a financial year.
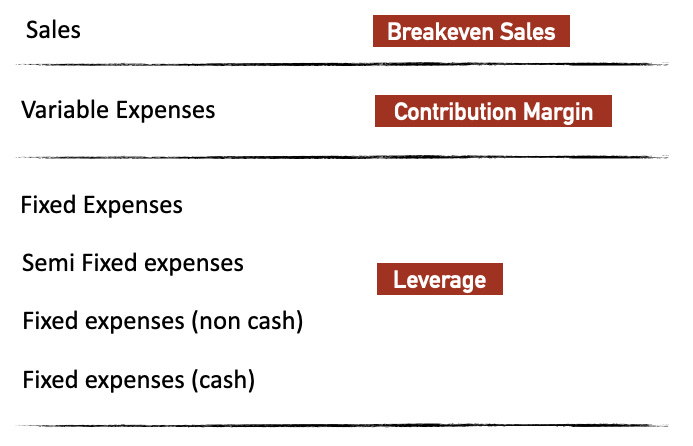
To arrive at the level of margin of safety, we need to find out the cushion available between breakeven sales and actual sales. The break-even analysis determines what level of sales are necessary to cover the company's total fixed expenses.
However, if we take a practical view, then there are various levels of breakeven sales. For this, we need to subdivide the expenses into variable expenses, semi fixed expenses, fixed expenses (non cash) and fixed expenses (cash).
Variable Expenses are those expenses which are required to be incurred depending on sale of goods or services. For example raw material consumption is a variable expense. With variable expenses, we can calculate contribution margin i.e. Sales - Variable expenses.
Fixed Expenses are incurred irrespective of sale of goods or services like for example, interest on Debt, staff salaries, power consumption for running machinery, depreciation of fixed assets, etc.
While most of the fixed expenses are required to be incurred in case of marginal decline in sales like say 10% decline in sales, there are certain fixed expenses which can be reduced in case of drastic decline in sales during extreme scenarios like present COVID-19 pandemic. These expenses can be termed as Semi Fixed Expenses. One example of semi fixed expenses is staff salaries wherein a company can cut down manpower incase of drastic decline in sales. Another example of semi fixed expenses is Power consumption wherein a company can run the factory for a single shift of 8 hours instead of 3 shifts to reduce power consumption. Advertising expenses can also be classified as semi fixed expenses.
Certain fixed expenses are non-cash in nature like depreciation and amortisation wherein a company incurs the cost of acquiring fixed assets at the time of purchase. The cost is however depreciated over a period of time based on the useful life of the asset.
Semi fixed expenses and non cash based fixed expenses give us an idea of operating leverage of the company.
Fixed expenses which are other than non cash and semi fixed are generally finance costs i.e. interest cost on debt raised by the company. We can arrive at financial leverage based on such expenses.
We can observe that a company can avoid operating expenses (fixed or variable) during tough times, but cannot avoid finance costs. Hence, financial leverage reduces the margin of safety available in a company.
After categorising the expenses into above categories, we can visually plot the Profit & Loss statement as a graph with Sales on X - Axis and Contribution Margin on Y - Axis. For example, I have visually plotted Profit and Loss statement for FY2020 of consolidated financials of Symphony Limited as under:
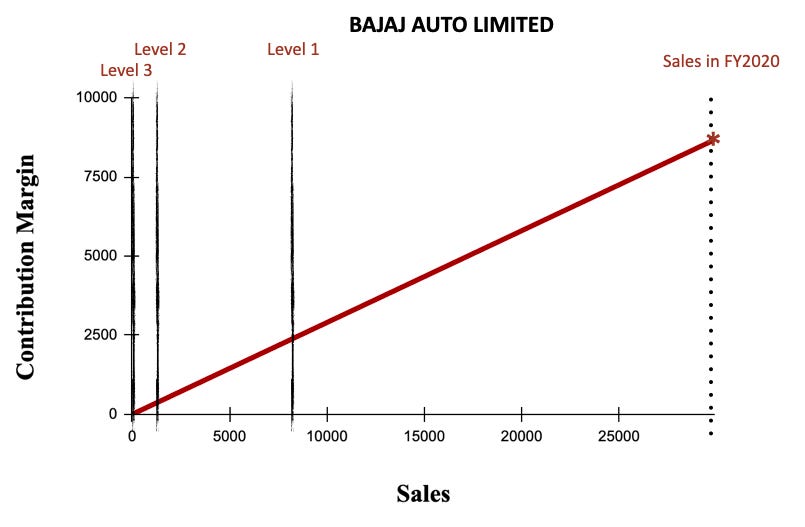
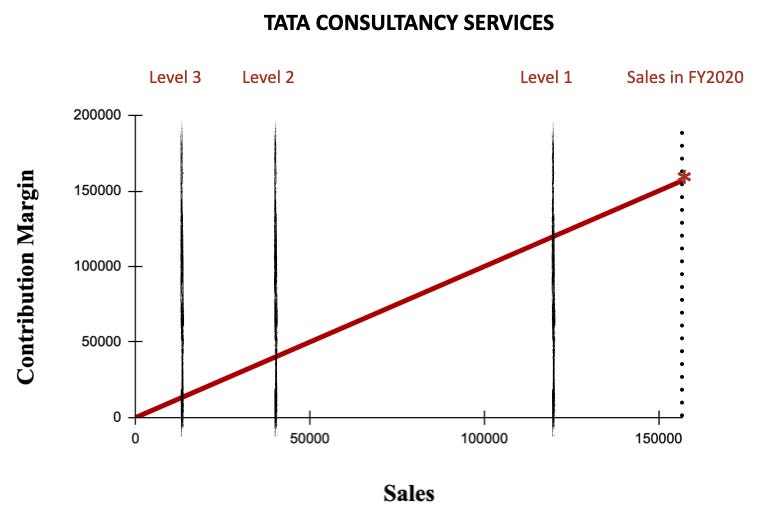
Dotted line in the above visual representation is actual sales in FY2020. Level 1 line represents breakeven sales considering total fixed expenses comprising of semi fixed costs, fixed expenses (non cash) & fixed expenses (cash). Level 2 line represents breakeven sales considering fixed expenses (cash) and fixed expenses (non cash). Level 3 line represents breakeven sales considering only fixed expenses (cash).
The wider the gap between actual sales and Level 1, 2 & 3 breakeven sales, the more the level margin of safety. With this visual representation, we can easily make out the level of margin of safety available in the company. Level 1 breakeven sales is Rs 721 Crs as against actual sales of Rs 1102 Crs. Level 2 breakeven sales is Rs 68 Crs and Level 3 breakeven sales is Rs 23 Crs.
Note: For actual sales, we need to exclude non-operating income like income from surplus cash, etc and only include operating income for better representation.
Few Examples
Below are examples of visual representation of Profit & Loss statements of companies falling under various levels of margin of safety i.e. low, moderate & high level of margin of safety.
High Margin of Safety
As we can observe, Bajaj Auto Limited has an adequate margin of safety.
For Tata Consultancy Services (TCS), the gap between Actual sales and Level 1 Breakeven sales is not so wide. However, the same is mainly because TCS being a services company, the semi fixed costs are majorly in the nature of salaries. The company will be able to cut down manpower if required incase of drastic decline in sales. This is the reason the gap between actual sales and level 2 and level 3 breakeven sales are also equally important as they give us the level of margin of safety available in the company.
Low or Moderate Margin of Safety
As we can observe, Sanghvi Movers and Ramky Infrastructure are incurring operating losses due to which the Level 1 Breakeven Sales is more than Actual Sales in FY2020. The level of margin of safety in Sanghvi Movers is slightly higher than Ramky Infrastructure due to higher Fixed Expenses (non cash) and lower Fixed Expenses (Cash) i.e. lower financial leverage. Hence, based on Level 2 and Level 3 breakeven sales, we can conclude that Sanghvi Movers has relatively higher margin of safety as compared to Ramky Infrastructure.


