NIFTY fell by ~10% from it's all time high in December 2022 - Understanding the fall through volatility
NIFTY fell by nearly 10% from 18800 levels in December 2022 to 17000 levels in March 2023.
If you try to find reasons for this fall by going through financial news, typical reasons you will find are startup funding winter, FIIs withdrawing money, tech layoffs, Adani impact, Banking crisis in USA, etc.
In this post I'll try to explain this fall through volatility. Markets, unlike Gravity, move both up and down. These up and down movements are called Volatility. These up and down movements are temporary. Volatility gets magnified when we see the markets with a short time horizon like say a few months. Let's look at NIFTY chart for the past 10 years instead of 3 months as above.
The 10% fall in the past 3 months appears like a small blip in the 10 years chart of NIFTY. Overall NIFTY has multiplied nearly 3 times in this 10 years which is a CAGR of ~12%. The NIFTY chart appears like an upward trending line except for a few blips in between.
The more the time horizon, the lesser the volatility as the up and down movements appear like small blips in a 10 year chart instead of large movements in a 3 month chart.
Is the volatility high at present?
We have an Index called INDIAVIX which measures short term volatility for a time horizon of 30 days. INDIAVIX is a short form for India Volatility Index. It is a volatility index based on the NIFTY Index Option prices. It measures the market's expectation of volatility over the next 30 days. Higher the INDIAVIX values, higher the expected volatility and vice-versa.
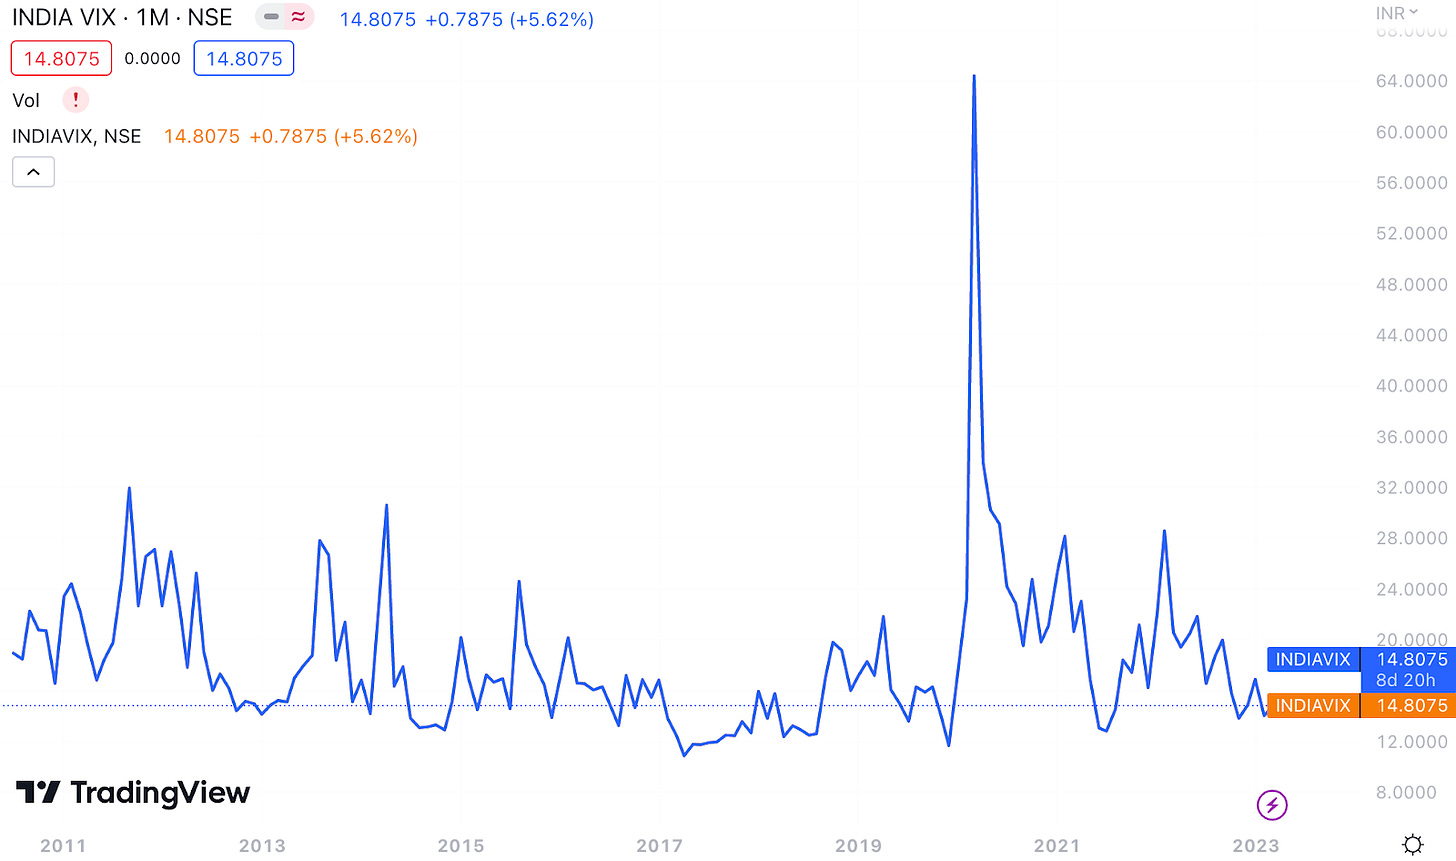
INDIAVIX is presently at 14.8 levels which is nearly the average levels since 2011. Hence, present volatility is at all time average levels.
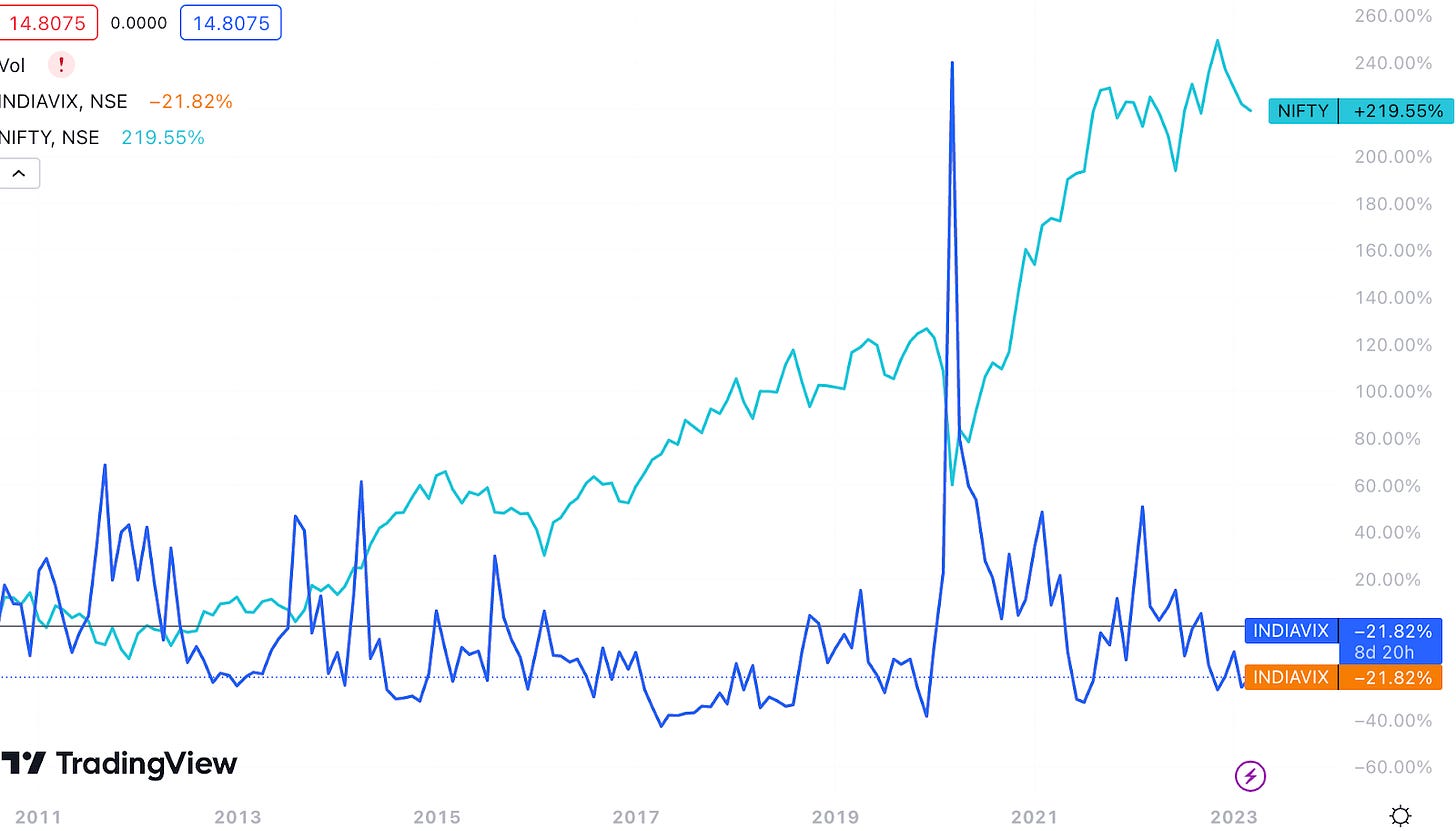
If you look at the INDIAVIX chart, you might have observed a steep spike in 2020. Volatility during COVID-19 crisis was high during the steep fall in March 2020. You can observe the same by looking at below charts of NIFTY and INDIAVIX.
During the volatility spike in 2020, NIFTY fell steeply by nearly 40% in March 2020. NIFTY again started increasing subsequently.
As explained above, INDIAVIX measures volatility only for a short time horizon of 30 days due to which there is a spike in March 2020 as the NIFTY fell by nearly 40% in a span of 30 days. However, Volatility reduces with increase in time horizon as these up and down movements appear like small blips. We unfortunately do not have an index to measure volatility for longer time horizons.
Tools at our disposal to beat volatility
Following are 2 tools at our disposal to beat volatility
Time Horizon: As explained above, higher the time horizon, lower the volatility
Systematic Investment Plan (SIP): SIP ensures that we invest during both up and down movements thereby mitigating volatility.
If you are interested in fundamental analysis in stock market investing, then why not subscribe to my newsletter. You can expect insightful posts every Sunday like this one by subscribing to this newsletter. Please also share this newsletter with your friends and colleagues as it might benefit them as well.


I was not aware of INDIAVIX index, so thanks for this new info dude.
But since this index is only for past 30 days, there is no way we can use this to make investment plans. For eg, just before the Covid crash the Vix index was below the average levels. So while understand what the Vix index is showing, I don't see the how this is useful.