First Pillar of Investing - Avoid investing in Fragile companies - Introducing the Fragility Score Card: Financial Statement Analysis made easy
Introduction:
While analysing a company from an investment perspective, we need to look at three important pillars.
Pillar 1 : Avoid investing in fragile companies -
We can measure fragility of a company through financial statement analysis. I explained the same in my post How to measure fragility in a company using financial statement analysis with Castrol Limited as Case study (budgetiger.in)
Pillar 2:
Pillar 2: Avoid investing in overvalued companies as overvaluation makes our investment fragile -
I explained about overvaluation in my post Overvaluation increases fragility of our investment & Stock Market is not always right (budgetiger.in)
Pillar 3: Avoid investing in companies whose Management has fragile mindset -
I explained about management analysis in my post A Step-by-Step Approach to Management Analysis for Companies (budgetiger.in)
Each of the three pillars are important. In this post, I would like to explain more on Pillar 1 i.e. Avoid investing in fragile companies.
Fragility of a company can be measured through financial statement analysis. There are four key financial ratios to measure a company's fragility.
The Four Key Financial Ratios:
1. Equity as a Percentage of Balance Sheet: This ratio measures a company's financial leverage by comparing its equity to its total assets. A higher percentage indicates that the company relies less on debt financing and has a stronger financial position and accordingly a higher equity percentage indicates the company is less fragile.
2. Break-Even Sales as a Percentage of Actual Sales: This ratio reveals the proportion of sales required to cover a company's fixed and variable costs. A lower percentage means that the company can generate profits more easily, indicating financial robustness.
3. Return on Capital Employed (ROCE): ROCE is a profitability ratio that measures how efficiently a company is using its capital to generate returns. A higher ROCE suggests that the company is using its resources more effectively, which is a positive indicator of financial health. Further a higher ROCE indicates that there is some inherent strength in the business model of the company due to which the company is able to generate higher returns on its capital employed.
4. Cash Flow from Operations as a Multiple of Yearly Debt Obligations Plus Depreciation: This ratio measures a company's ability to generate sufficient cash flow to meet its debt obligations and cover depreciation expenses. A higher multiple indicates that the company has a better cash flow position, which is essential for its long-term financial robustness
I prepared a Fragility Score Card, a tool that uses the above four key financial ratios to measure a company's fragility. In this post, I will explain how the Fragility Score Card works and how you can use it to easily analyze financial statements of a company using this fragility score card.
The Fragility Score Card:
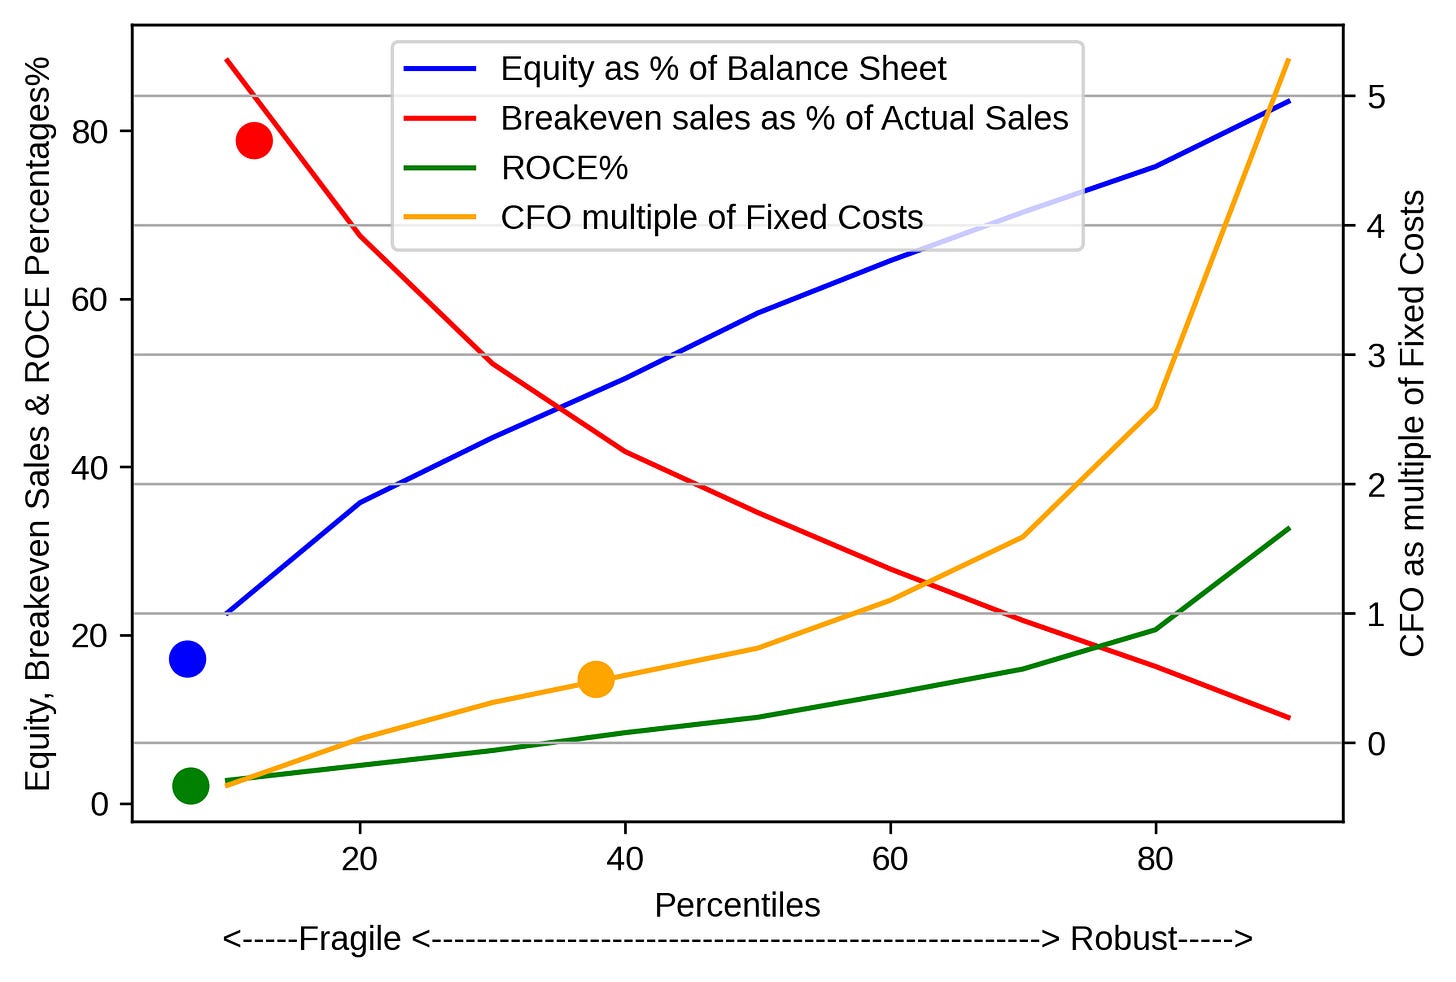
I shortlisted companies listed on NSE/BSE with more than Rs 100 Crs market cap. There are more than 2100 such companies. I then calculated the 10th, 20th, 30th, 40th, 50th, 60th, 70th, 80th, and 90th percentiles of each of the above four key financial ratios to create a Fragility Score Card. By comparing a company's financial ratios to these percentiles, we can easily determine its fragility and overall financial health.
Below are the values of each ratio at respective percentiles
I believe that a picture explains more than words. That's why, I tried displaying the fragility score card in a plot.
Using the Fragility Score Card:
To use the Fragility Score Card, follow these steps:
1. Calculate the four key financial ratios for the company you're analyzing.
2. Plot the company’s ratios in the above fragility score card plot.
3. If the company's ratios appear in the right side of the plot, then the company is robust. If the ratios appear on the left side of the plot, then company is fragile.
4. Alternatively, if you are more comfortable dealing with tables, then compare the company's ratios to the respective percentiles on the Fragility Score Card table. If the company’s ratio are at a higher percentile, then the company is robust. If the ratios are at a lower percentile, then the company is fragile.
Few Examples:
Asian Paints
Asian Paints has moderate Equity as a % of balance sheet ratio. Further, its Cash Flow multiple is also moderate. However, it has very good Breakeven % and ROCE. Cash Flow multiple is low in FY2022 partly due to increased inventory and receivable levels in that year. However, the multiple is higher historically for the company. As per the above, company appears to be more robust.
Bharti Airtel
Bharti Airtel appears to be more fragile based on these four key ratios. This is understandable considering the regulatory constraints in the industry and also intense competition in the form of Jio.
Larsen & Turbo
L&T appears to be more fragile based on all the four ratios. However, if I compare the ratios of L&T with earlier three years, then ratios of L&T are improving year on year.
Infosys
Infosys financials appear to be robust based on the four key ratios.
Conclusion:
The Fragility Score Card is an invaluable tool for investors looking to ease the financial statement analysis. By using this scorecard and plotting the ratios of a company, you can easily measure the fragility of a company’s financials.
Thank you for reading and subscribing to my newsletter! I hope you found it valuable and informative. If you did, please share it with your friends and colleagues who might also benefit from it. It only takes a few seconds to forward this email or click on the social media buttons below. Your support means a lot to me and helps me reach more people like you.


Sir, please show as an example with banking and financial sectors. How to find its breakeven sales.
Can you share the results?